
INTERFEROMETRY - FRINGES AND PHASES

Source: https://m.wikidata.org/wiki/Q2098218
INTERFEROMETRY - FRINGES AND PHASES
PHOTONS
Photons are the basic units of light. They display the properties of both waves and particles. If you find this confusing, think how photons must feel! It is the wave-like property that leads to interference. The waves are sinusoidal in character, continuous and alternating in positive or negative sign. Interference can be additive or subtractive, depending on whether the photons are in phase or out of phase.
If two are exactly in phase, they will have twice the intensity of a single photon. But when they are exactly 180 degrees out of phase they will cancel each other, resulting in no light appearing at a detector. Of course, single photons are rare. Under most circumstances there will be groups or bundles of light consisting of countless photons.

Protons and neutrons in atomic nucleus and orbiting electrons
What are Fringes?
Fringes are also called light bands. They are alternating lines or regions of dark and light formed by imaging the interference pattern from a reference surface and an optic being tested. They are analogous to contour lines on a topographical map. Each dark fringe is a locus of points for an equal optical path difference between that highly accurate reference and a (generally) distorted test wavefront. These dark points are the result of destructive interference.
Dark fringes are most obvious to the eye, which is sensitive to contrast but not so much to intensity. Hence it appears that there are wide bands of light between dark fringes, because of partial destructive interference between the brightest bands where photons are exactly in phase.
It is uncommon that wavefronts interfering will be exactly the same intensity, though a minor mismatch will still be perceived as dark and light lines. Detectors used for imaging interference patterns are able to discern the slight variation in intensity between the darkest and brightest areas.
So, What is Interference?
Interference is the property of electromagnetic waves that combine to form a resultant wave for which the intensity is reinforced or cancelled. In most cases, the intensity is neither doubled nor totally cancelled, because the waves combining are seldom exactly the same intensity. In general, visible electromagnetic radiation is measured, but infrared or ultraviolet light can be measured with a suitable detector.
When two perfect planar (plano, in optical jargon) waves interfere, they will combine to form a darker or lighter wave, depending on the distance each travels. An optical path length difference will determine if the interference is additive or subtractive. A change of distance difference travelled by light in a purely piston type displacement will change the intensity. If a slight angle or tilt is introduced between the two, alternating light and dark bands, fringes, will be observed. The number of these fringes is directly proportional to the amount of tilt introduced. There are techniques to measure the wedge angle of a flat optic by the fringes produced by that wedge.
Wavefront Measurement by Fringes
Source : Interference Fringes
Before light sources with considerable coherence length were available (think lasers), opticians formed fringe patterns using a test plate, also known as an optical flat. Spherical test plates also exist, to check the surface of lenses, or curved mirrors. These test plates could be placed in close proximity to each other, so common light sources could be used.
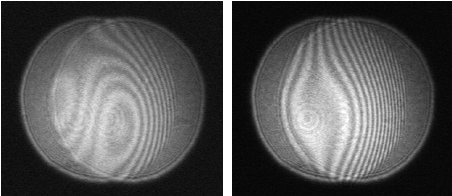
If the mismatch between the surfaces has spherical power, circular fringes will form. For greater mismatch, more fringes form. This leads to some confusion when testing flat surfaces. If the mismatch between the test flat and the optic is small (less than a half wave length of the light being utilized), no round fringes will form. But if there is tilt (or wedge), many fringes can form. It is essentially the straightness of the pattern that determines flatness, not the fringe count.
When two wavefronts interfere, if they are perfect matches but with some tilt introduced, a particular fringe pattern is formed. A perfect pattern has fringes that are straight, parallel, and evenly spaced. Straightness and parallelism are readily evaluated by eye. But spacing difference is not so easily detected. For this reason, it is common to adjust the tilt and observe orthogonal fringes, which will show curvature in the plane of the spacing difference.
A dark region forms when the path length between the reference and test reflection are out of phase by 180 degrees, a half wave. Each additional dark region (typically a fringe) is formed for every increase of path length by a half wave. Light travels to the test surface and back on itself, so a half wave of separation results in a full wave of path length.
When the difference between surfaces (thus reflected wavefronts) is less than a half wave and irregular, and there is no wedge between them, the observer or light detector will see a mottled pattern reminiscent of the shadows of the moon. If wedge is introduced, the fringe lines will be somewhat jagged. But most often optics are polished by a smooth motion, which will produce straight or curving fringes without abrupt features.
Laser interferometers allow producing fringe patterns without requiring that the surfaces be close together. That is a consequence of the relatively long coherence length of most lasers.
Fringe Pattern Conversion to Waves
When multiple circular fringes are detected, counting from a null fringe to the furthest outlying fringe yields double the error in waves, so the rule of thumb is a fringe equals a half wave. If the error is less than a full fringe, some wedge may be introduced. In that case, the departure from the perfect pattern (straight, parallel, equally spaced) must be determined. Usually a photograph or similar output would be produced. Manual processes to analyze the patterns are tedious but yield results. Those may be limited in accuracy or subjective.
A number of automated fringe analyzing methods exist. Some are programmed into the interferometers. Others are separate instruments. These would typically determine points along the fringe centers, and calculate the difference from the ideal pattern. If enough points were measured, the result might be expressed in peak-to-valley, as well as cylinder, astigmatism, and local slope.
Intensity Measurement
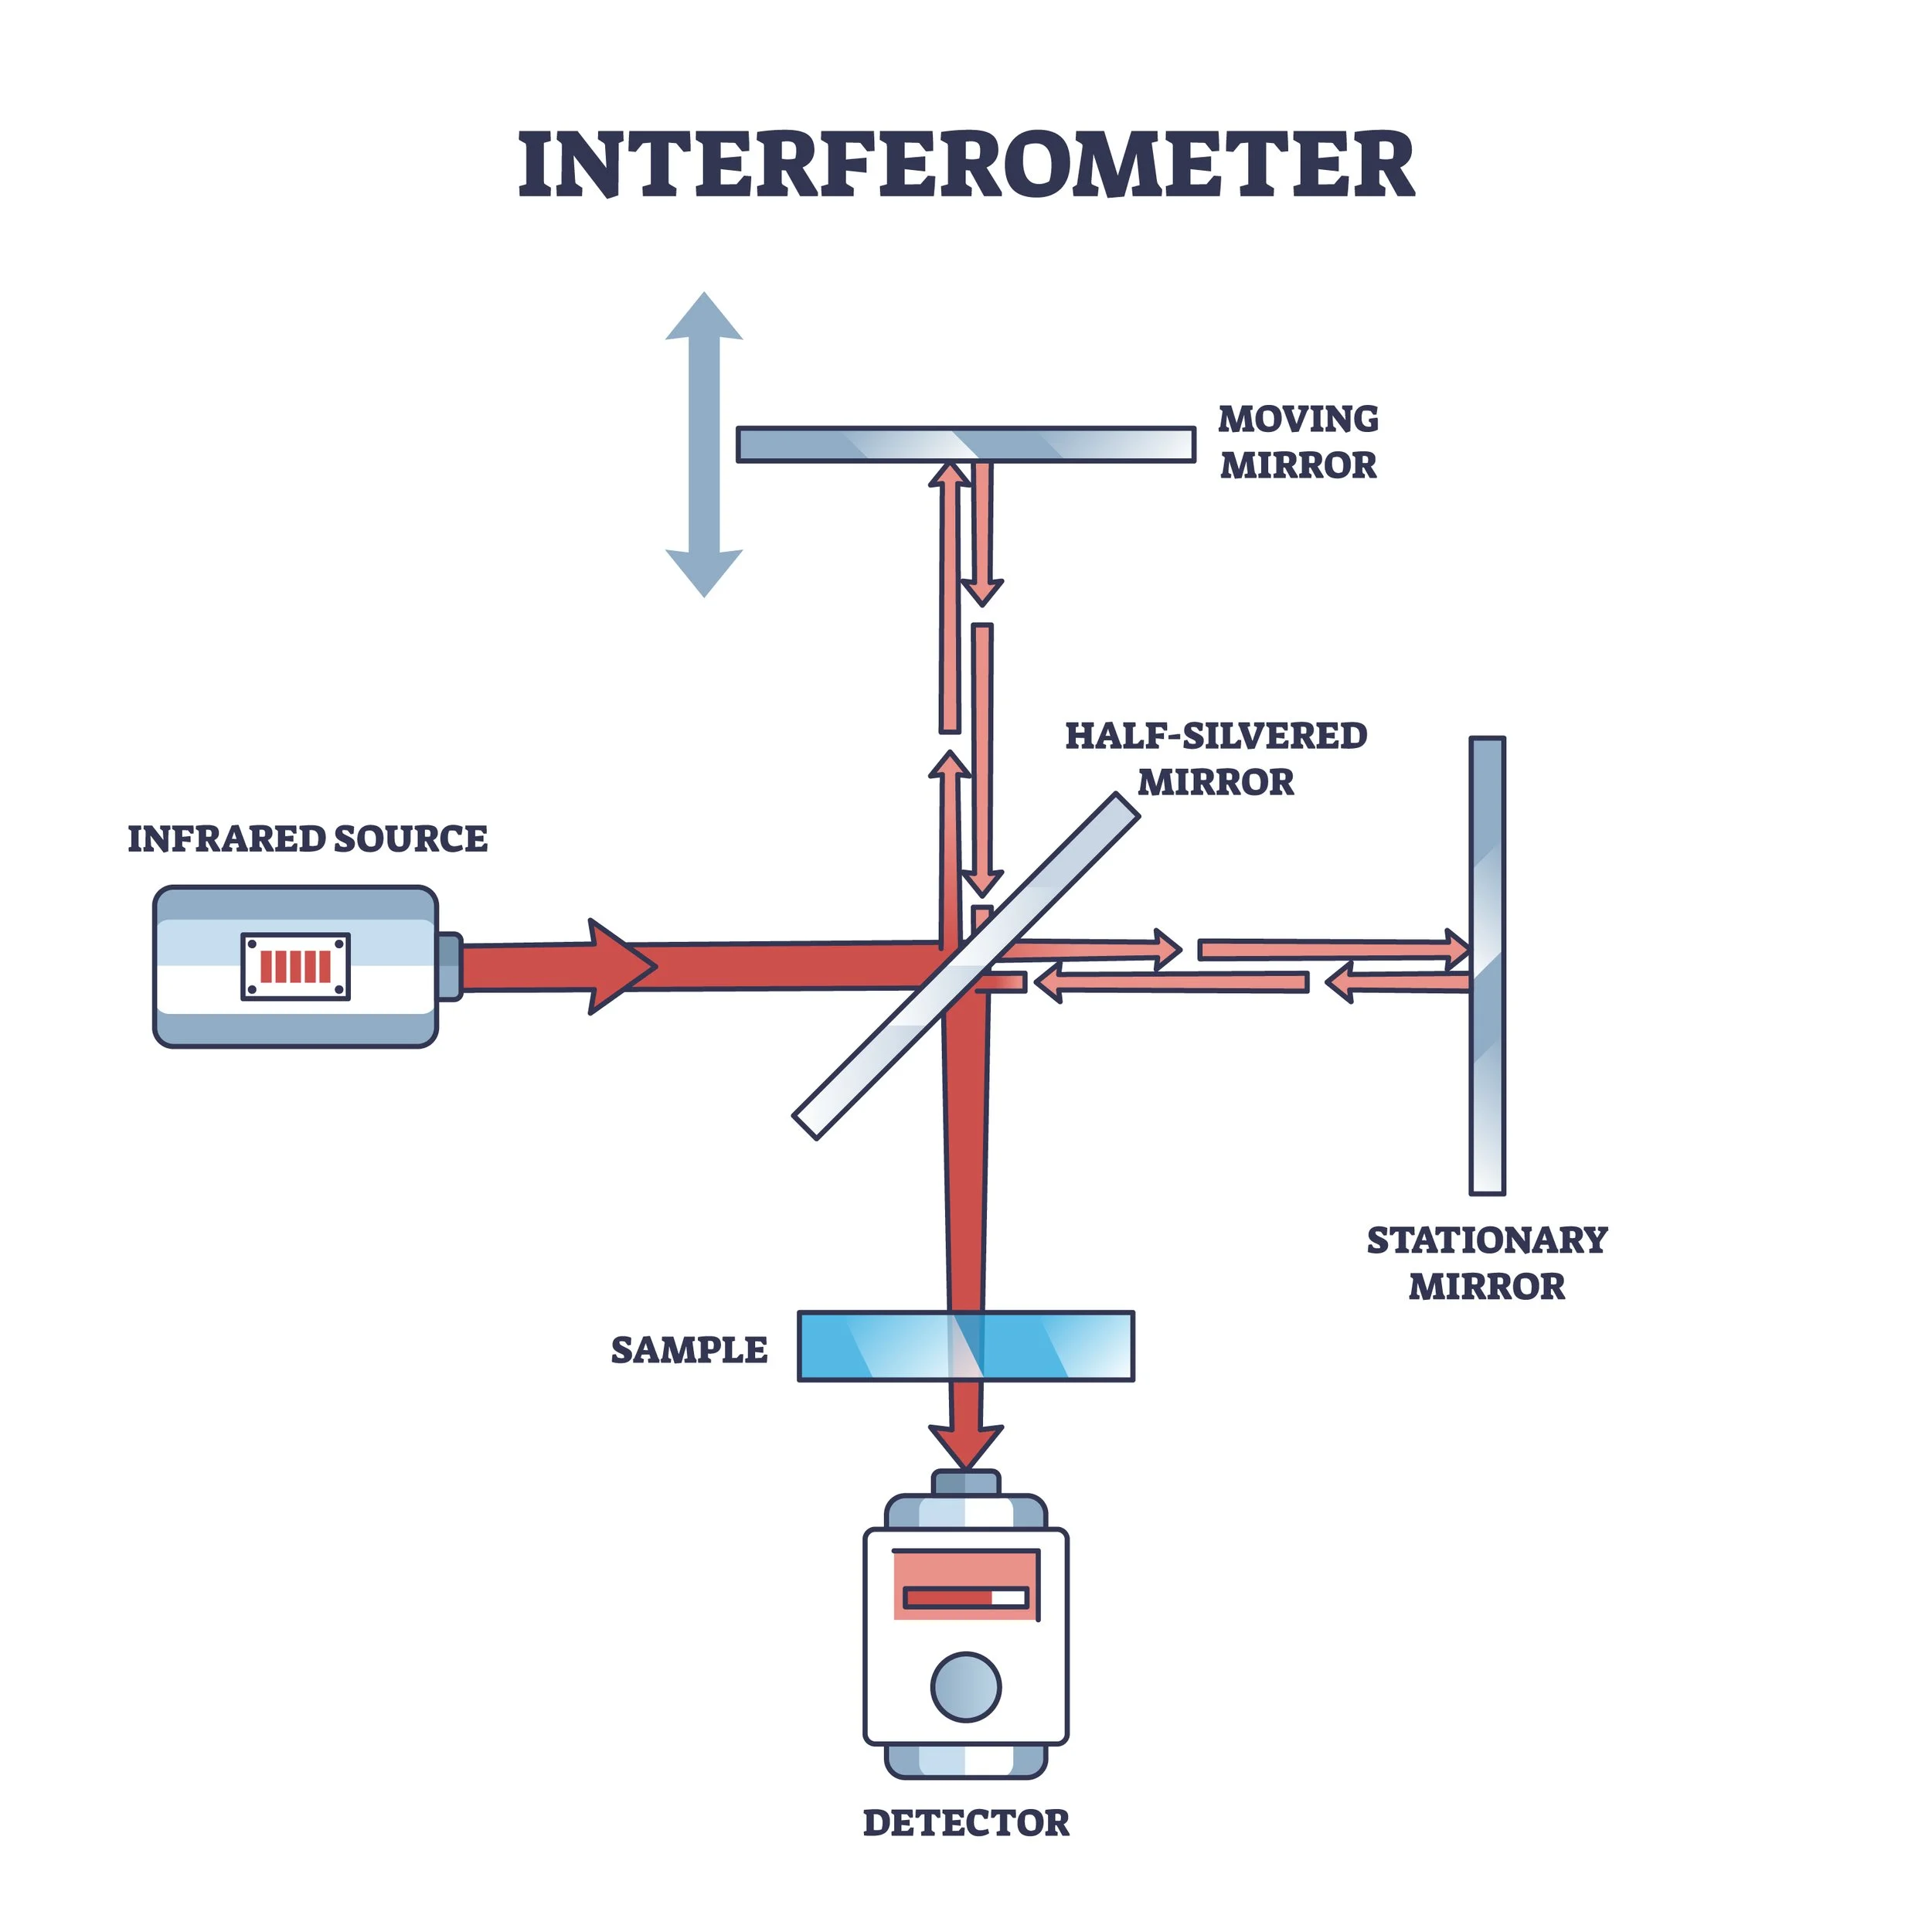
Interferometer
More advanced interferometers detect intensity patterns, using a great many pixels. These can measure smaller errors than fringe measuring interferometers. They also measure many more points, approximating a continuous pattern. To calculate the sign of a wavefront (plus or minus, equating to an expanding or converging wavefront, caused by a convex or concave acting optic), requires a series of “snapshots” of the intensity pattern. Usually there are three or more discrete values. The large quantity of points also lends itself to special values, beyond peak-to-valley or other first and second order values. Slope and PSD (power spectral density) expressions can also be calculated.
There are a few different methods of measuring intensity variation and converting them to wavefront error expressions. The amplitude and sign are essential values. To distill the intensity patterns, a series of at least three measurements is made. Each is recorded at a predetermined difference in phase. The phase difference may be incurred by a number of methods. Moving the reference flat of the interferometer is common. Two other techniques actually take advantage of the wave behavior of a laser source. One hops between two close frequencies of the laser. Another shifts rapidly between two polarization states of the laser beam. Both of those methods remove the need to move part of the measurement cavity. They also can be very quickly modulated. In either case the measurement assembly may be more rigid, and the influence of vibration or air currents is minimized.
Summary
It is worth noting that neither fringe nor intensity measurements are measurements of wavefront! Each type of interference pattern is a “map” of intensity variation. Those darker to lighter discriminations are converted by some algorithm built into the measuring device, the interferometer. There is a one-to-one correlation of brightness to phase difference. It is that connection that allows calculating the items of interest, the wavefront values.
What sets GAMDAN Optics apart is our innovation. We work with engineers and scientists to find custom solutions for your material needs. Contact GAMDAN today about your specific material needs.
DENNIS J. GARRITY, AUTHOR
Dennis is an engineer with over 45 years of experience in fabrication, testing, and material evaluation for high precision optics, with extensive hands-on experience. More on the author can be found here.
Did you enjoy this article? Sign up to receive articles we publish straight to your email box here: